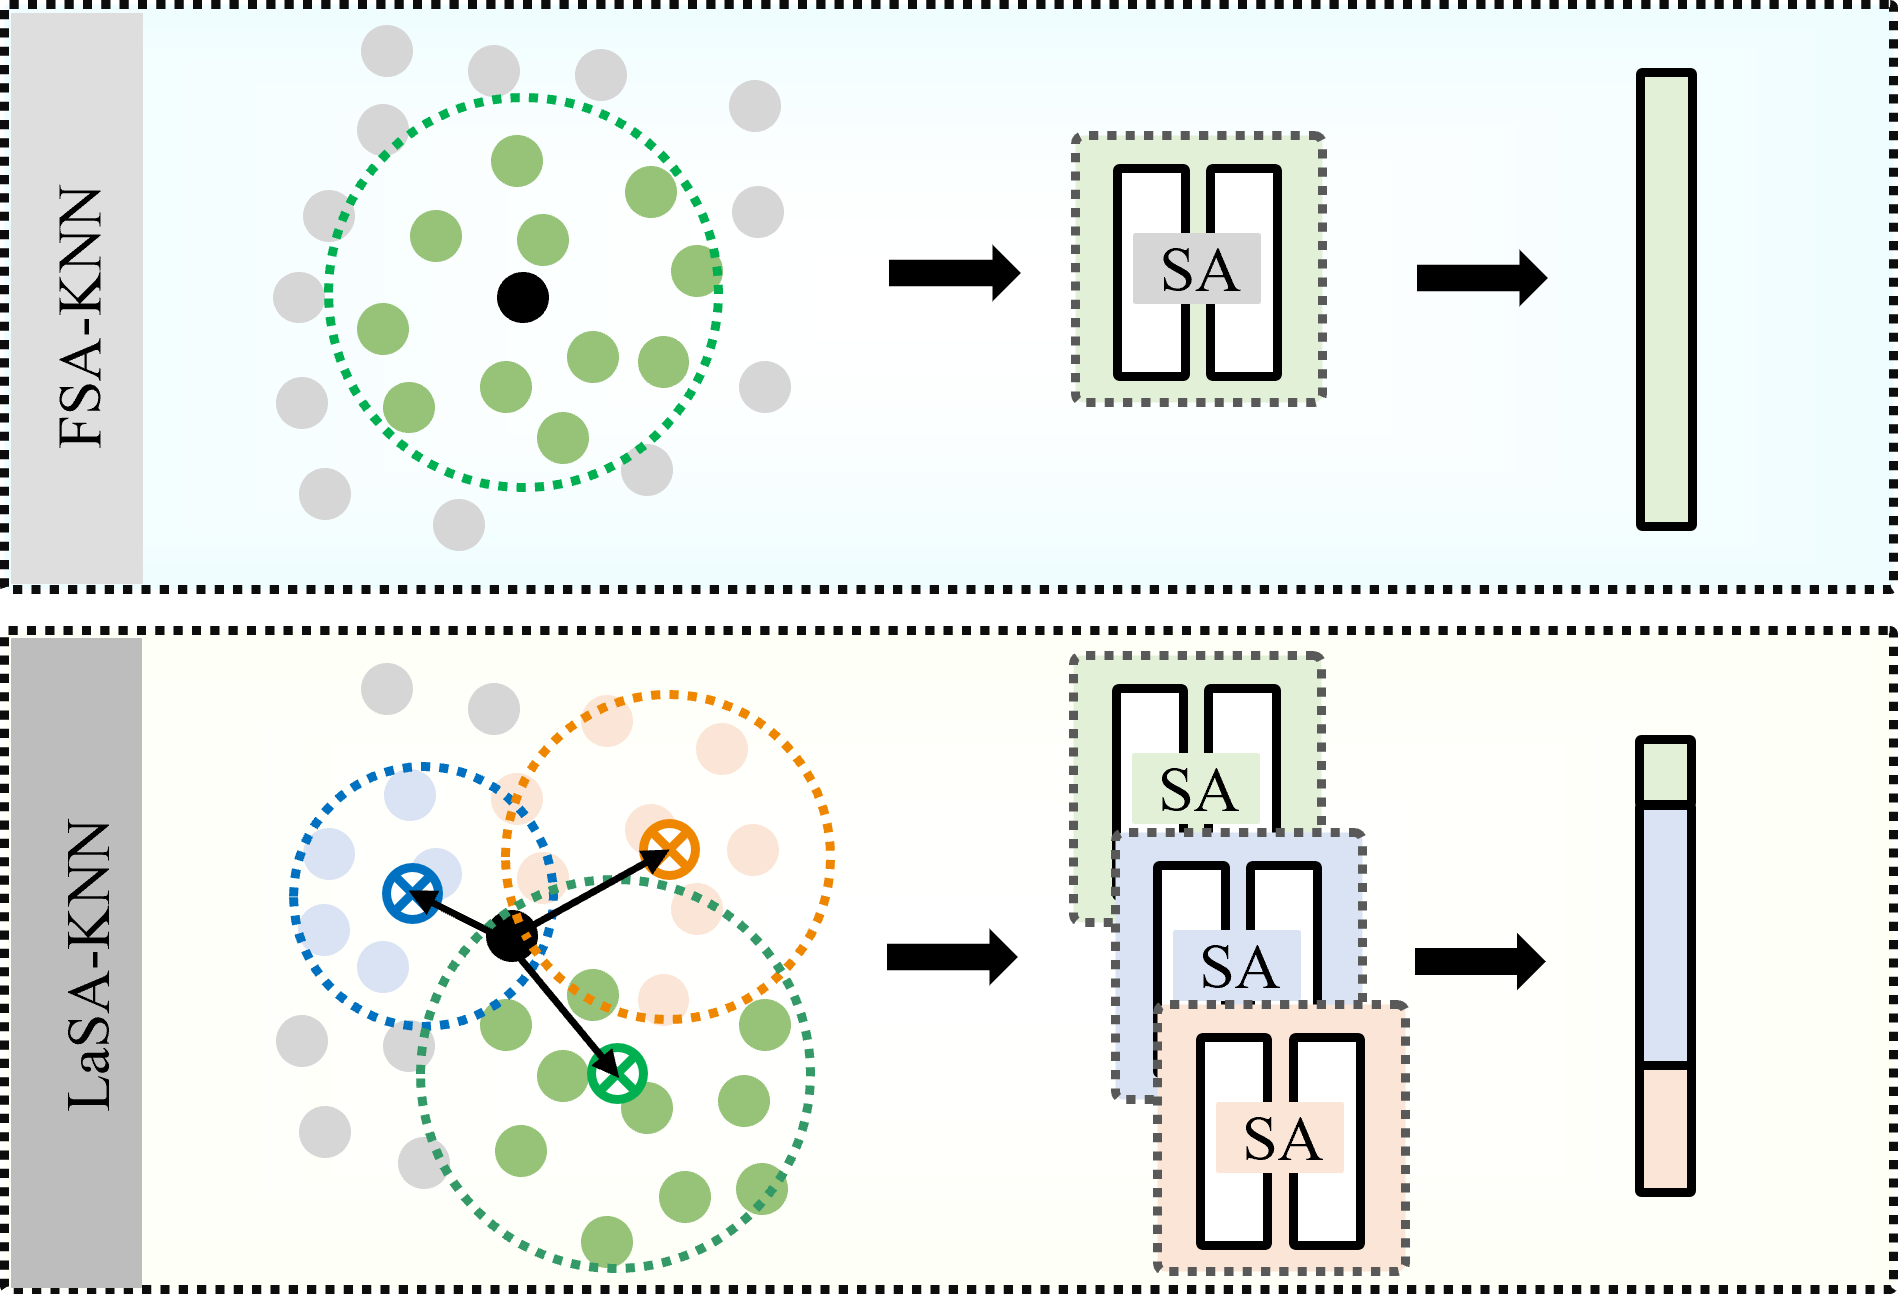
    The code will be released
-------------------------------------------------------------------------------
Algorithm 1: MultiHeadOffsetKNN
Input:
  xyz ∈ ℝ^{B×N×3}          -- original point coordinates
  feat ∈ ℝ^{B×N×C}         -- point features
  knn_coarse ∈ ℤ^{B×N×Kc}  -- coarse KNN used for offset computation
Hyperparameters:
  k_list = [k_1,...,k_M]   -- per-head k values (M heads)
  p_hidden                 -- hidden dim for offset MLPs

Network Components:
  offset_mlp1: Linear(C → 3M)               # self-offset from feat
  offset_mlp2: MLP(3 → p_hidden)            # neighbor coords -> p_hidden
  offset_mlp3: MLP(C → p_hidden)            # center feat -> p_hidden
  offset_mlp4: Linear(2·p_hidden → 3M)      # combine -> neighbor-offset

Initialization:
  offset_mlp1, offset_mlp4 weights & biases ← 0
  offset_mlp2, offset_mlp3 linear layers ← kaiming init, biases ← 0

Forward:
  1. B,N,Kc ← shape(knn_coarse)
  2. offset_self ← offset_mlp1(feat)                      # ℝ^{B×N×3M}
     offset_self ← reshape(offset_self, (B,N,M,3))       # ℝ^{B×N×M×3}
  3. pts_knn ← index_points(xyz, knn_coarse)              # ℝ^{B×N×Kc×3}
     pts_center ← pts_knn - xyz.unsqueeze(2)              # ℝ^{B×N×Kc×3}
  4. ps_feat ← offset_mlp2(pts_center)                    # ℝ^{B×N×Kc×p_hidden}
     ps_agg  ← max_k(ps_feat)                             # ℝ^{B×N×p_hidden}
  5. f_proj ← offset_mlp3(feat)                           # ℝ^{B×N×p_hidden}
     f_knn_proj ← index_points(f_proj, knn_coarse)        # ℝ^{B×N×Kc×p_hidden}
     f_agg ← max_k(f_knn_proj)                            # ℝ^{B×N×p_hidden}
  6. el_input ← concat(ps_agg, f_agg)                     # ℝ^{B×N×2·p_hidden}
     offset_neigh ← offset_mlp4(el_input)                 # ℝ^{B×N×3M}
     offset_neigh ← reshape(offset_neigh, (B,N,M,3))     # ℝ^{B×N×M×3}
  7. new_xyz ← xyz.unsqueeze(2).expand(B,N,M,3) + offset_self + offset_neigh
     # new_xyz ∈ ℝ^{B×N×M×3}
  8. for h in 1..M:
       q_h ← new_xyz[:,:,h,:]                             # ℝ^{B×N×3}
       idx_h ← knn(q_h, xyz, k_list[h])                   # ℤ^{B×N×k_h}
     end for
  9. return idx_list = {idx_1, ..., idx_M}

-------------------------------------------------------------------------------

Algorithm 2: MultiHeadOffsetLPA
Input:
  x ∈ ℝ^{B×N×C}                -- input features
  idx_list = {idx_1,...,idx_M}  -- per-head neighbor indices, idx_i ∈ ℤ^{B×N×K_i}
Components:
  proj_i: Linear(C → D_i) for i=1..M   (bias=False)
  bn_i: BatchNorm1d(D_i) for i=1..M
Forward:
  1. features ← []
  2. for i in 1..M:
       f_i ← proj_i(x)                              # ℝ^{B×N×D_i}
       idx_i ← idx_list[i]                          # ℤ^{B×N×K_i}
       f_pool ← knn_edge_maxpooling(f_i, idx_i, training)  # ℝ^{B×N×D_i}
       f_bn ← bn_i( reshape(f_pool, (B*N, D_i)) )   # (B*N, D_i) -> reshape -> (B,N,D_i)
       append f_bn to features
     end for
  3. out ← concat(features, dim=-1)                 # ℝ^{B×N×ΣD_i}
  4. return out

-------------------------------------------------------------------------------

Algorithm 3: Mlp (Point-wise MLP with BN)
Input:
  x ∈ ℝ^{B×N×C}
Hyperparams:
  mlp_ratio, bn_momentum, act
Network:
  hid = round(C * mlp_ratio)
  mlp_net = Linear(C→hid) → act() → Linear(hid→C, bias=False) → BatchNorm1d(C)
Forward:
  1. x_flat ← reshape(x, (B*N, C))
  2. y ← mlp_net(x_flat)
  3. return reshape(y, (B, N, C))

-------------------------------------------------------------------------------

Algorithm 4: Block (Residual + two-stage MH-KNN + LPA)
Input:
  xyz ∈ ℝ^{B×N×3}
  x ∈ ℝ^{B×N×dim}
  knn_raw ∈ ℤ^{B×N×Kc}        -- coarse KNN for offset computation
Components:
  mlp, mlps (a small stack), drop_paths (length = depth),
  mhknn0, mhknn1: MultiHeadOffsetKNN instances
  mh_lpa0..3: MultiHeadOffsetLPA instances

Forward:
  1. x ← x + drop_paths[0]( mlp(x) )
  2. knn0 ← mhknn0(xyz, x, knn_raw)
  3. x ← x + drop_paths[0]( mh_lpa0(x, knn0) )
  4. x ← x + drop_paths[1]( mh_lpa1(x, knn0) )
  5. x ← x + drop_paths[1]( mlps[0](x) )
  6. knn1 ← mhknn1(xyz, x, knn_raw)
  7. x ← x + drop_paths[2]( mh_lpa2(x, knn1) )
  8. x ← x + drop_paths[3]( mh_lpa3(x, knn1) )
  9. x ← x + drop_paths[3]( mlps[1](x) )
 10. return x

Notes:
- index_points, knn, knn_edge_maxpooling, DropPath are assumed helper functions.
- Initializing offset linear layers to zero keeps early training stable.

